Flooding as a result of a cloudburst event can have a major impact on important functions and structures in society. It can also result in major costs, due to damage to properties and buildings. In Botkyrka, a climate vulnerability analysis was conducted, which revealed a need to perform a detailed mapping of the town’s vulnerabilities in the event of cloudbursts, with regard to both existing and new buildings. This was conducted in the form of cloudburst mapping, which identified places that could require further consequence analyses. This in turn could indicate a need for preventive measures, preparedness plans or greater consideration given to the elevating of new constructions.
A 2017 report from SMHI shows that an increase in cloudburst events can be expected in the future. Among other things, the modelling indicated that the expected recurrence interval for a 20-year rainfall may decrease to 6-10 years during the summer. In the winter, this recurrence interval may fall to 2-4 years. This is based upon a comparison between the period 1961-1990 and the scenario for 2071-2100. This provides an indication of the probability of cloudburst events in the future.
Working process
The basis of the work involved in cloudburst mapping came from a climate strategy that was adopted by Botkyrka Municipality in 2009. The work began by conducting a climate vulnerability analysis, which showed the sites in the municipal area that were most vulnerable to changes in the climate. The municipality began to produce detailed material for the areas of weakness identified by the analysis.
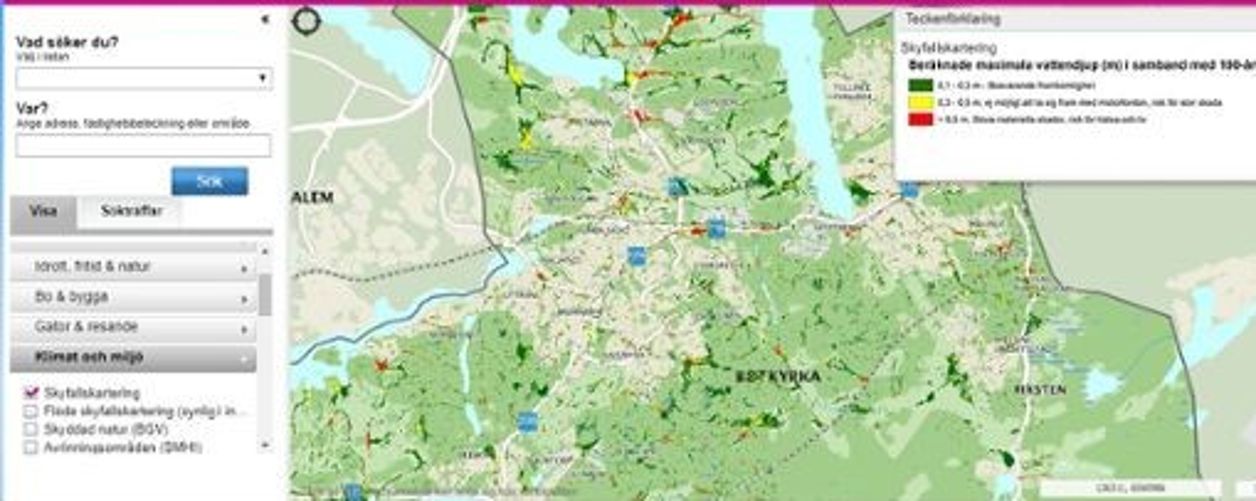
In 2015, work began to produce the definitive map. This was based on the new national elevation database produced by the Swedish National Land Survey, which provides better results than the previous database. A consultancy agency developed a model and produced a report concerning the existing buildings in the municipality’s urban areas, as well as in the areas separating these. The municipality’s representatives can use the model to see how planned buildings may affect the ways in which water drains.
They have elected to not make the findings available to the public at the present time. The results are, however, used in their internal work so that the municipality’s employees can gain an overall picture of the flood risks in the areas of interest. The results of the mapping are also included in communication with developers in order to show where there is a need for extra elevation or any other measures.
To bear in mind
It is important to have a solid foundation of work that has been produced in accordance with a well-considered climate strategy, from general plan to assignment.
Begin with a climate vulnerability analysis to identify whether there is a need for cloudburst mapping to be prioritised in your municipality.
The raw data from such a mapping does not provide much information in itself, and should really be regarded as just one of several tools in your development work. The mapping will need to be coprocessed with facts from the municipality’s other data sources.
A well-produced mapping can be very helpful to understanding the path of water flows in your urban areas.
More examples of climate adaptation
This is one of many examples of climate adaptation. There are more in the collection of ideas being built up by the Swedish National Knowledge Centre for Climate Change Adaptation at the Swedish Meteorological and Hydrological Institute (SMHI). The collection of examples has the aim of sharing experiences and providing ideas to everyone who works with climate adaptation. Examples describe concrete measures and challenges in several subject areas. They show how different actors have worked to adapt their activities to the climate changes that are already being noticed today and those that we cannot prevent in the future.